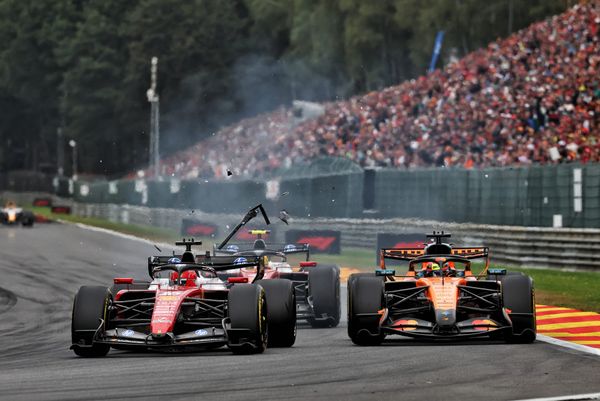
Mark Hughes: What testing long runs say about F1 2023
It’s only a few days to go before we know for real, but Formula 1’s three-day Bahrain test did give us something to work with in trying to understand the competitive order among the teams.
The variations in track temperature, tyre compounds and likely fuel loads muddy the superficial picture. We know the compounds and track temperature for every run but not the fuel loads. But if we at least compare only race simulations, where teams have done a clear sequence of three stints, changing tyre compounds at each stop before immediately rejoining, using all three compounds, then we can build up some sort of picture much more sophisticated than just the headline times.
The runs we have identified as likely race simulations are as follows:
| Friday | ||||
| Begins | Stint 1 | Stint 2 | Stint 3 | |
| Red Bull | 8.46am | 12 laps C3 | 15 laps C2 | 21 laps C1 |
| Alfa Romeo | 2.55pm | 15 laps C2 | 18 laps C1 | |
| AlphaTauri | 8am | 15 laps C3 | 18 laps C1 | 13 laps C3 |
| Williams | 1.45pm | 17 laps C3 | 18 laps C1 | 16 laps C2 |
| Ferrari | 2.45pm | 11 laps C3 | 16 laps C1 | |
| Saturday | ||||
| Begins | Stint 1 | Stint 2 | Stint 3 | |
| Ferrari | 2.47pm | 14 laps C3 | 12 laps C1 | |
| Mercedes | 8.58am | 11 laps C3 | 17 laps C2 | 13 laps C1 |
| Alfa Romeo | 8.28am | 17 laps C1 | 13 laps C2 | 10 laps C3* |
| Haas | 1.15pm | 14 laps C3 | 11 laps C2 | 15 laps C1 |
| AlphaTauri | 8.21am | 15 laps C2 | 18 laps C1 | 11 laps C3 |
| Williams | 1.50pm | 16 laps C3 | 15 laps C1 | |
| Haas | 1.15pm | 14 laps C3 | 11 laps C2 | 15 laps C1 |
* Alfa’s run incomplete due to PU issue
In addition to those runs, there were slightly anomalous runs from McLaren (two consecutive 10-lap stints on the C3 and C2 on Friday) and Alpine (a 16-lap run on the C3 on Friday and a 14-lap run on the C1 on Saturday). Aston Martin also appeared to do partial race sim runs on Friday.
Taking each day in isolation, we get the following picture of the average lap times of each stint:
| Friday | |||||||||
| Stint 1 | Stint 2 | Stint 3 | |||||||
| C1 | C2 | C3 | C1 | C2 | C3 | C1 | C2 | C3 | |
| Red Bull | 1m38.3s | 1m38.5s | 1m37.8s | ||||||
| Ferrari | 1m39.3s | 1m37.9s | |||||||
| Aston Martin | 1m39.3s | ||||||||
| McLaren | 1m39.9s | 1m38.1s | |||||||
| Alfa Romeo | 1m40.2s | 1m39.9s | 1m38.1s | ||||||
| Alpine | 1m37.9s | ||||||||
| AlphaTauri | 1m40.5s | 1m39.2s | 1m38.6s | ||||||
| Williams | 1m41.1s | 1m39.3s | 1m38.8s | ||||||
| Saturday | |||||||||
| Stint 1 | Stint 2 | Stint 3 | |||||||
| C1 | C2 | C3 | C1 | C2 | C3 | C1 | C2 | C3 | |
| Ferrari | 1m38.7s | 1m37.4s | |||||||
| Aston Martin | 1m40.0s | 1m39.5s | 1m38.3s | ||||||
| Mercedes | 1m40.2s | 1m39.2s | 1m37.8s | ||||||
| Haas | 1m41.1s | 1m39.6s | 1m38.7s | ||||||
| Alfa Romeo | 1m39.7s | 1m39.0s | 1m37.3s* | ||||||
| Williams | 1m39.6s | 1m38.4s | |||||||
| AlphaTauri | 1m41.3s | 1m40.0s | 1m39.1s | ||||||
| Alpine | 1m39.4s** | ||||||||
* Alfa’s run incomplete due to PU issue
** Alpine single run, unknown which stint it simulated
These numbers are to be treated with caution because of the different times of day in which the runs were made. Those doing simulated runs on both days either improved a lot or the track was better on Saturday than Friday. Either way, with Red Bull not doing race runs on Saturday it leaves us without a good Saturday benchmark. But going off the gap between Red Bull and Ferrari on Friday and extrapolating it to Saturday, we get a competitive order something like:
1st – Red Bull
2nd= Ferrari/Aston Martin (+0.2s to Red Bull)
4th= Mercedes/Alpine (+0.6s to Red Bull)
6th= Haas/Alfa/McLaren (+1.05s to Red Bull)
9th – Williams (+ 1.25s to Red Bull)
10th – AlphaTauri (+ 1.45s to Red Bull)
Although the Ferrari (on the same C1 tyre) was only 0.1s off the Red Bull’s stint three average on Friday, it was 0.8s slower in the stint two simulations – more than Pirelli would assign as the difference between the Red Bull’s C2 tyre and the Ferrari’s C3. So the 0.2s difference we have assigned between the two cars is based on that.

But Saturday running did give us a very good read on the comparison between the Ferrari, Aston Martin and the Mercedes and they were quite closely matched.
The Alpine is a real dark horse and we have inserted it based only on two one-off long runs it did on each day which were not done in the sequence of a race simulation. We have had therefore to guess which stage of the race they represented. Similarly, McLaren’s running was so curtailed that it’s difficult to estimate what its two 10-lap runs on Friday represented. At the back, the Williams was slower than the AlphaTauri on Friday but appeared to have a much better Saturday to leapfrog itself ahead.
There is huge scope for variation in interpreting the data, as much of it is not directly comparable. But this represents our best guess until the cars start running together and it all becomes real later this week.